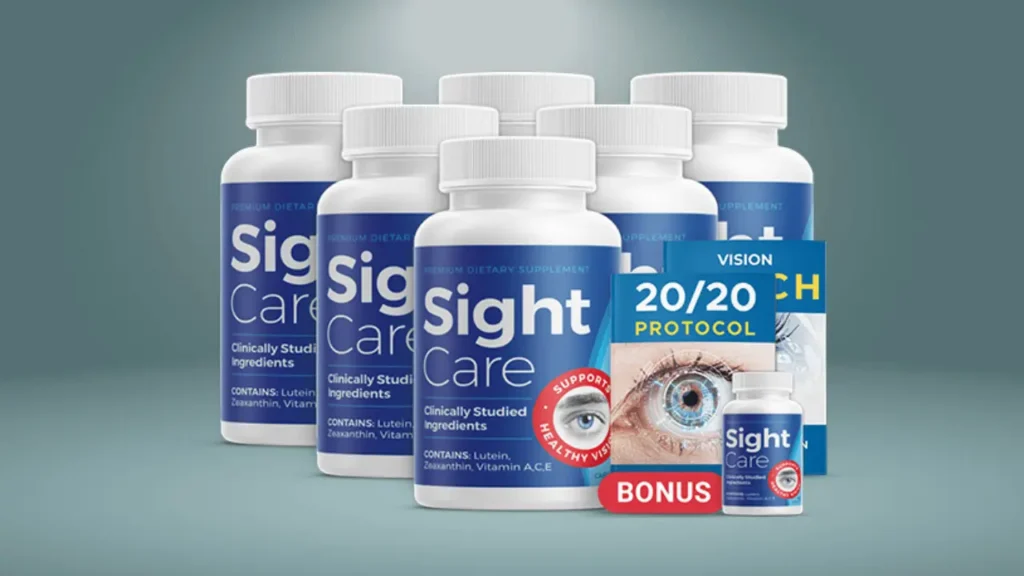
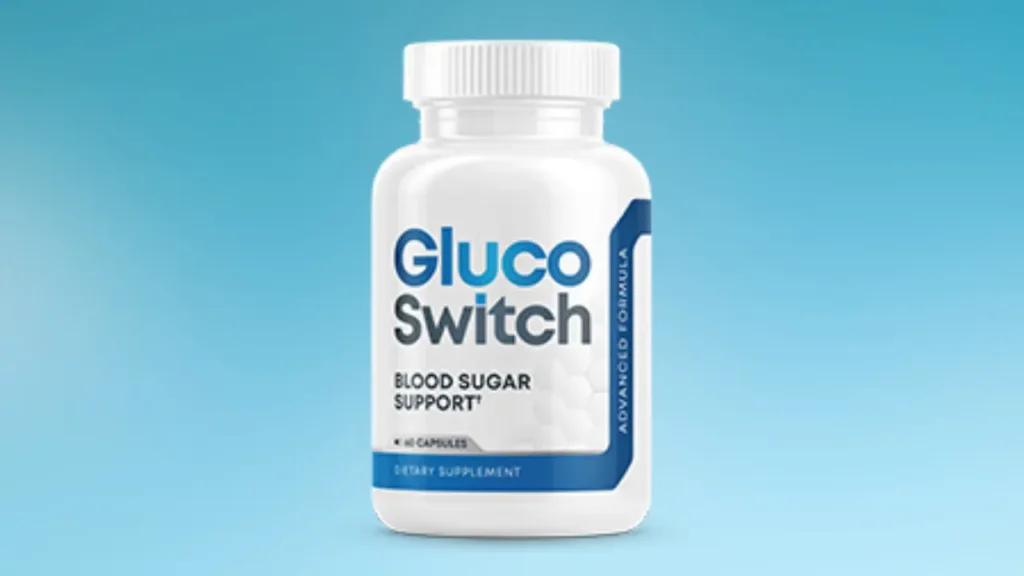
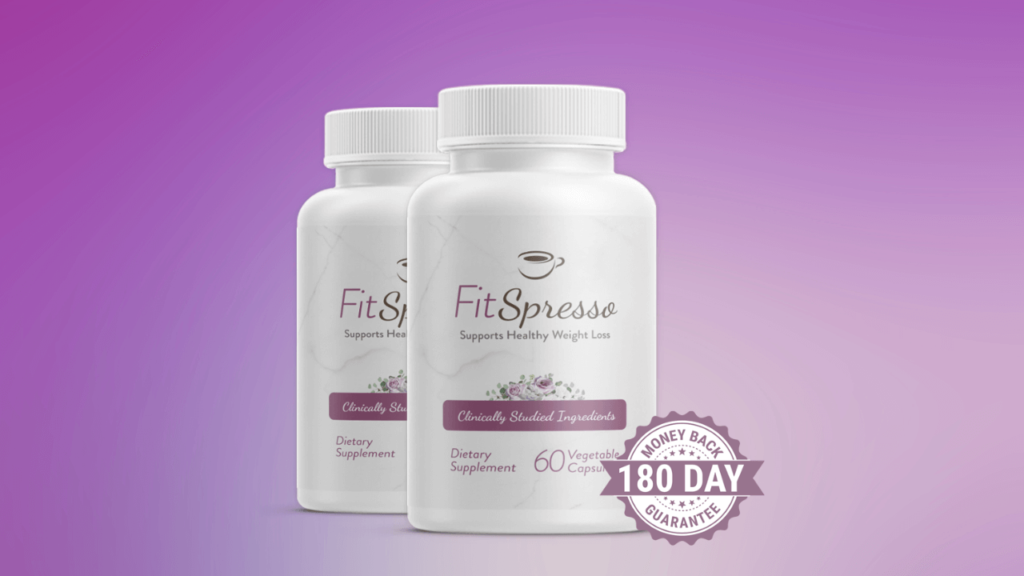
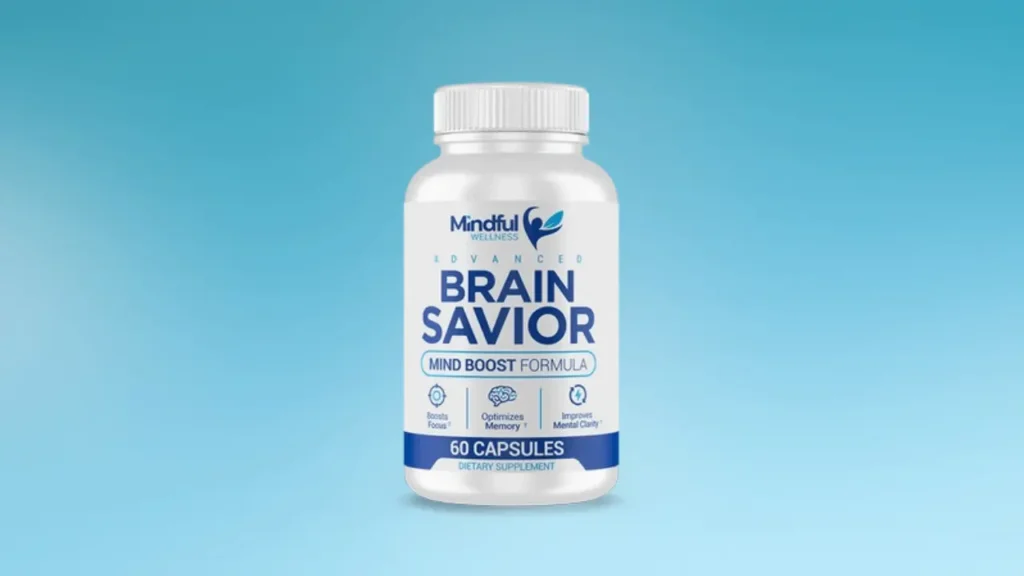
Business Intelligence Dashboards | Goodly Courses

Why should you consider learning this skill? (3 Reasons) It makes a ton of difference if you are able to pack your analysis in the form of an insightful and beautiful Dashboard. It gives a sense of finish to your work and looks refined and classy You’ll be able to […]


Why should you consider learning this skill? (3 Reasons)

  1. It makes a ton of difference if you are able to pack your analysis in the form of an insightful and beautiful Dashboard. It gives a sense of finish to your work and looks refined and classy
  2. You’ll be able to uniquely position yourself as a strong employee / candidate for a job or promotion
  3. You’ll be able to save time and focus on making decisions using Dashboards rather than wrestling with spreadsheets

Presenting

Learn the step by step process to create Beautiful, Interactive and Insightful Dashboards using Excel


Course Structure

The course is split into 2 parts

1. The Dashboard Toolkit – Library of tools and techniques that you can use in your own Dashboards

  • Module 1 : Dashboard Planning and Pre-Work – Learn a structured way to plan your Dashboard even before you start working with Excel
  • Module 2 : Advanced Excel Techniques – Out of the box Excel tricks and techniques that will help you create automated and dynamic spreadsheets
  • Module 3 : Visualization & Charting Library – More than 20 Visualization & Charting ideas that you can learn and implement in your own Dashboards
  • Module 4 : Dashboard Formatting & Design Principles – Learn the key principles to make your Dashboards look professional and clean

2. Comprehensive Case Studies – Learning to create Dashboards from scratch

  • Case Study 1 : Human Resource Dashboard
  • Case Study 2 : Sales Performance Dashboard
  • Case Study 3 : Company Cost Structure Dashboard

3. Bonus Material + Assignments – You’ll also get access to supplementary material + assignments to help you get hands on practice

  • 100 + Excel Shortcuts Pdf
  • Formula Library – 50 most important formulas explained + practice spreadsheets
  • Assignments – Interim Assignments + 1 Comprehensive Dashboard Assignment

This is exactly what you’ll learn in this course


Here is what you’ll get on Enrollment

  1. BI Dashboard Course + 3 Comprehensive Case Studies (1 year downloadable access)
  2. Bonus Material on Excel Formulas (Videos)
  3. One Comprehensive Assignment on a Dashboard Case Study

What should you expect after you are done with the course

  • You will be able to create World Class Dashboards with your own business data
  • Acquire an in-demand skill and position yourself strongly in front of your boss / management and colleagues
  • Save a ton of time by producing intelligent and visually appealing business reports rather than doing ad-hoc analysis
  • Learn variety of techniques to visualize data

Frequently Asked Questions

What is the level of the course ? I am a beginner, should I join the course? Are there any Pre-Requisites for this course?

The course is a step above the beginner / intermediate level. You need to have basic to intermediate level of Excel Skills. To be more specific you should be comfortable to work with

  • Simple Formulas (like IF, Vlookup, Index Match, SumIf, CountIf etc..)
  • Pivot Tables
  • Charts (creating, editing and formatting)
  • Some bit of conditional formatting

If you are not confident about Excel and want to learn Excel in depth along with Dashboards, then I strongly urge you to enroll in a combined course (BI Dashboards + Master Excel Step by Step). You can choose the combo option in the pricing plan

Master Excel Step by Step is a comprehensive course on Excel and covers all important concepts in Excel (Basic to Advanced)

Can I download the lectures/videos?

Yes all lectures are downloadable and you can keep them for later reference

Do I require the knowledge of VBA Coding to understand the course material ?

No you don’t need to know VBA for doing this course

Although some lessons of the course involve VBA but I have made sure that they are simple to understand and quickly replicable in your own Dashboards

What version of Excel is used?

I have used a mix of Excel 2013 & 2016 in this course. But even if you have older versions of Excel that should not be a problem because most concepts are universal in excel.

Where ever there is anomaly in any feature that is exclusively available in Excel 2013/16, I have pointed it out explicitly

How does the course look from inside?

Here is a short course tour video


DOWNLOAD THE LIST OF ALL FAQs

Source Article

Next Post

Entrepreneurs and Entrepreneurship Defined

Thu Mar 26 , 2020
Entrepreneurship An entrepreneur is an individual who starts and runs a business with limited resources and planning, and is responsible for all the risks and rewards of his or her business venture. The business idea usually encompasses a new product or service rather than an existing business model. Such entrepreneurial ventures target high returns with an equally […]

You May Like